The most important aspects of an Assumption education—forming the whole person, seeking truth, launching graduates into lives of meaning and purpose rooted in the principles of Catholic liberal learning—can’t be measured solely with numbers. But the education we provide does lead to many successes that can be quantified.
Here are some.
Retention
| First-Year Students Enter Date | Percent that Return the Following Fall |
| Fall 2022 | 83.5% |
| Fall 2021 | 82.7% |
| Fall 2020 | 82.1% |
| Fall 2019 | 83.1% |
| Fall 2018 | 84.5% |
Source: National Center for Education Statistics IPEDS Fall Enrollment Survey
Graduation Rates
Students who begin at Assumption
| First-Year Students Entering In: | Graduating in 4 Years or Less | Graduating in 6 Years or Less |
| Fall 2019 | 67.7% | N/A |
| Fall 2018 | 70.2% | N/A |
| Fall 2017 | 71.3% | 74.6% |
| Fall 2016 | 69.5% | 72.0% |
| Fall 2015 | 68.6% | 71.4% |
Source: Institutional data, National Center for Education Statistics IPEDS Fall Graduation Rate Survey
Students Who Transfer to Assumption
| Transfer Students by Class Year* | Graduating with Class Year | Graduating Within Two Years After Class Year |
| 2023 | 55.1% | N/A |
| 2022 | 69.5% | N/A |
| 2021 | 72.5% | 78.4% |
| 2020 | 50.0% | 61.1% |
| 2019 | 65.9% | 77.3% |
*The class year assigned to transfer students when they enroll at Assumption University; the assigned year reflects the “normal” time for these students to complete their degree, after taking transferred credits into account
Source: Institutional Data
Almost all Assumption University graduates complete their degree in four years or less
| First-Year Students Entering In | Percent of Graduates who Complete their Degrees in Four Years or Less |
| Fall 2018 | 92.9% |
| Fall 2017 | 95.6% |
| Fall 2016 | 94.1% |
| Fall 2015 | 96.1% |
| Fall 2014 | 95.7% |
Source: Institutional Data
Post-graduation Outcomes, 2020-2023

Source: Assumption University annual first destinations survey, six months post-graduation
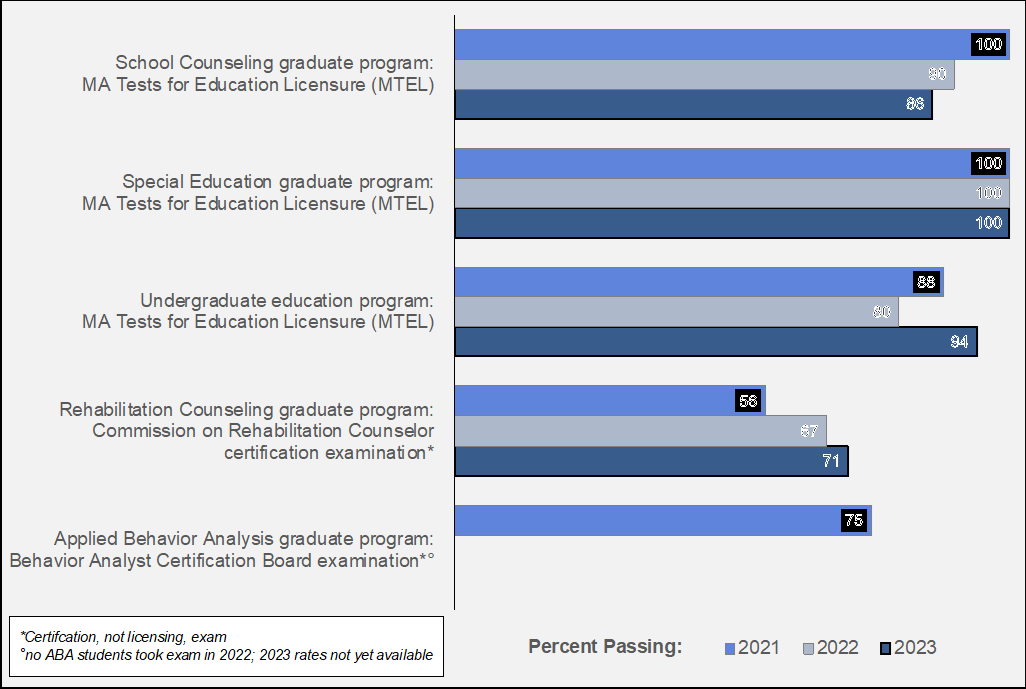
Licensure Passage Rates, 2021-2023

Source: Institutional data

